 Baltimore
 DC
DC
 Chicago
Baltimore Air Quality Analysis
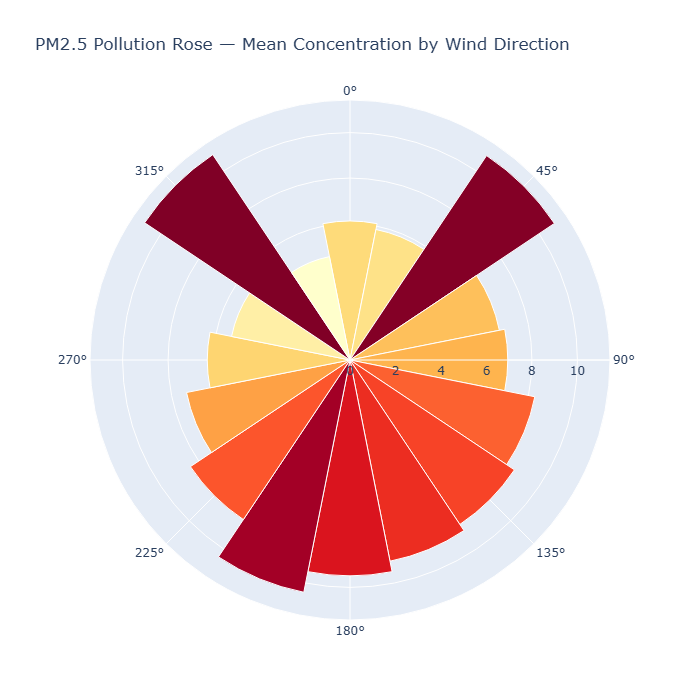
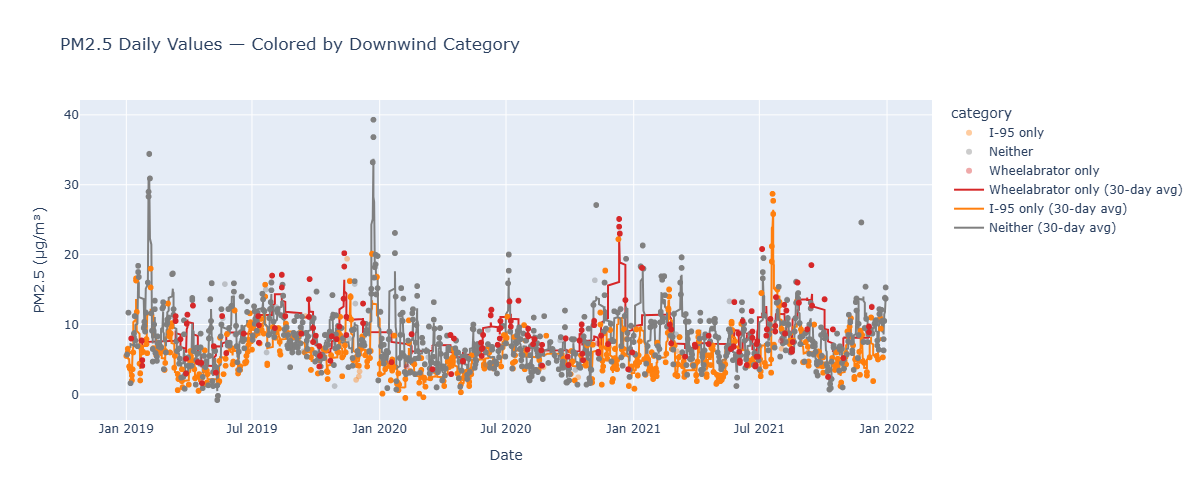
Investigates whether neighborhoods downwind of Wheelabrator Baltimore (the city's largest stationary air pollution source) experience worse air quality than those downwind of I-95 highway traffic.
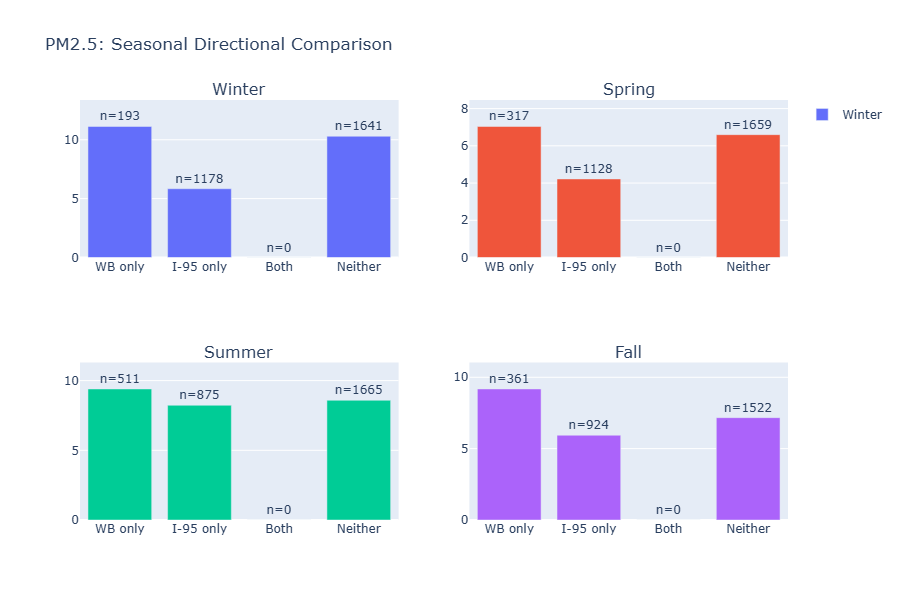
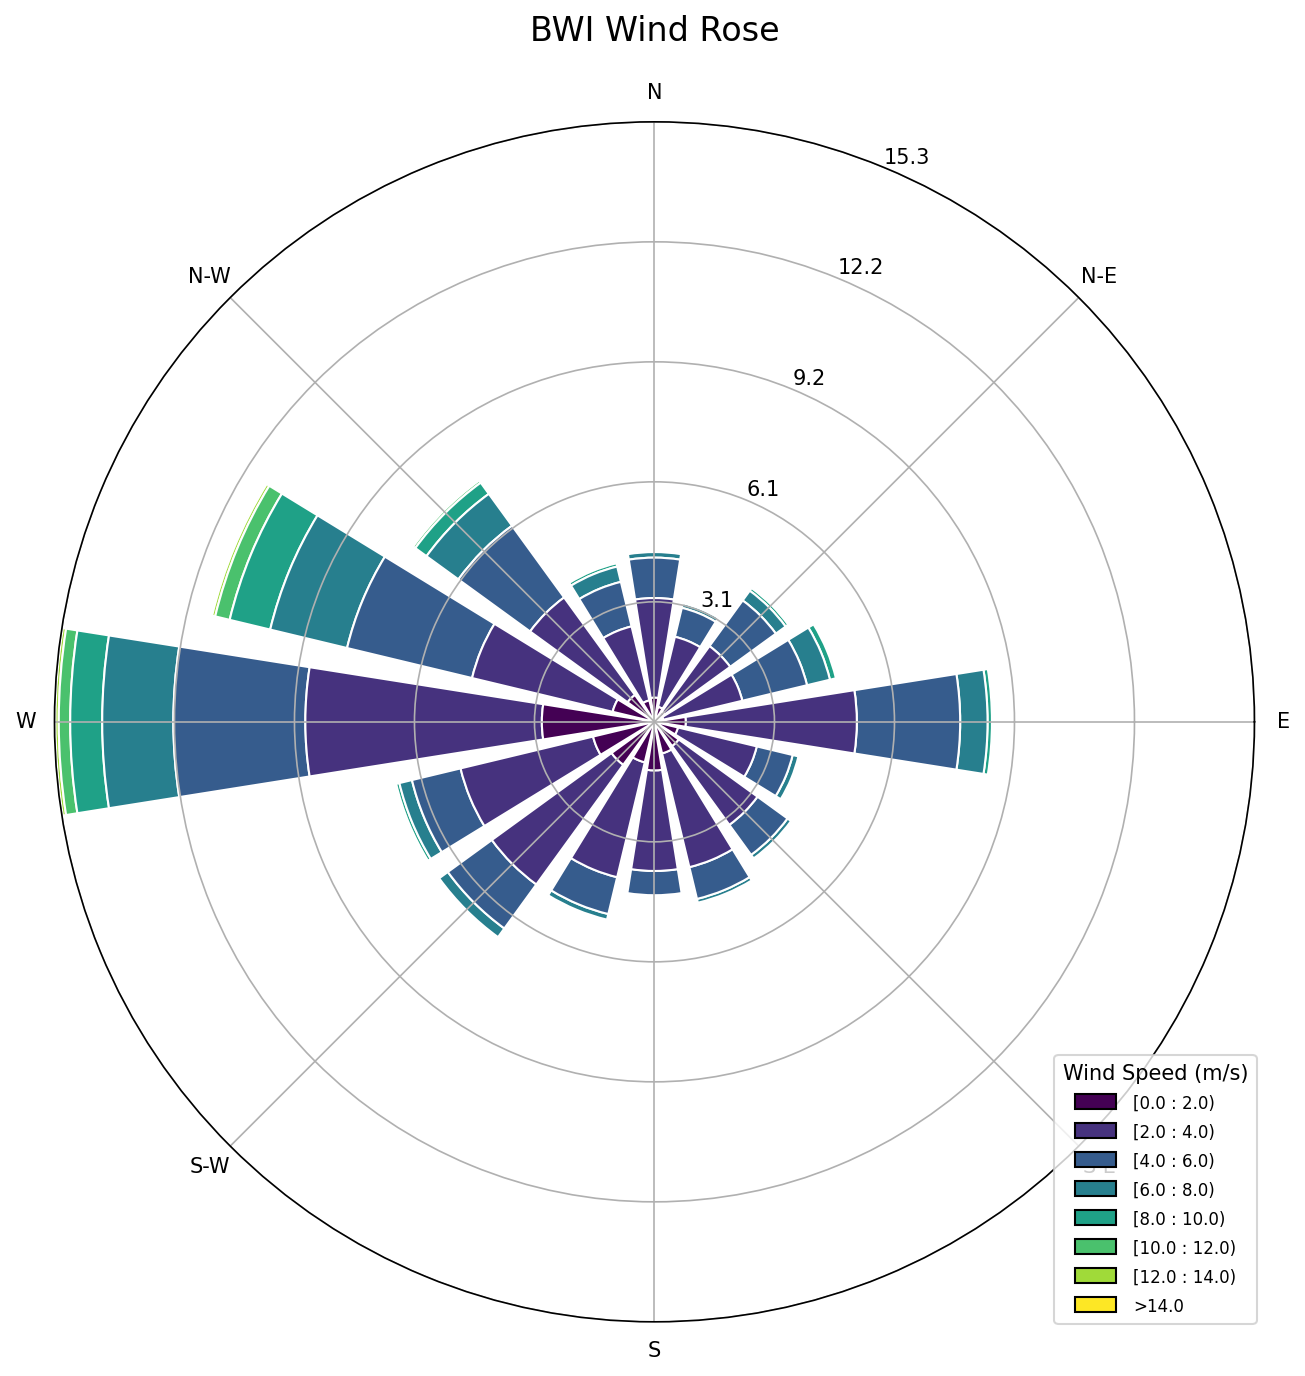
Built a full data pipeline that pulls 6 years of hourly wind data from Iowa Mesonet, daily pollutant readings from EPA AQS, and facility emissions from EPA NEI, then classifies each day by wind exposure and compares pollution levels across monitor stations.
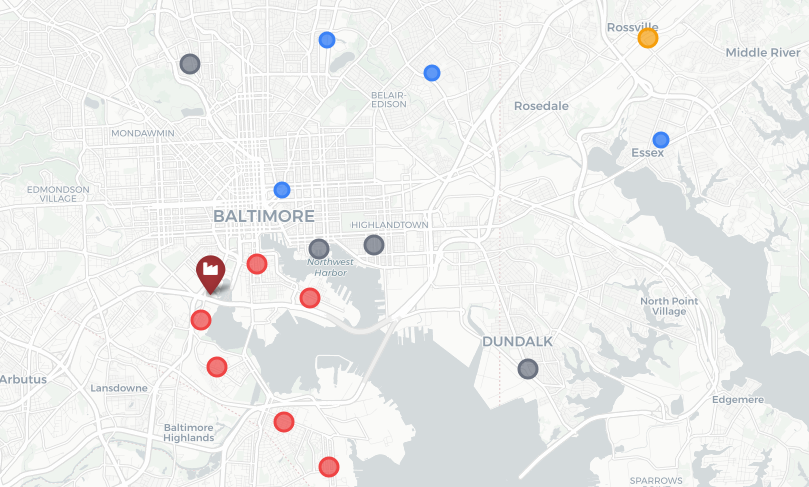
Features an interactive dashboard with Folium maps, Plotly charts, wind roses, pollution roses, directional comparisons, and seasonal breakdowns across 15 study neighborhoods in 3 exposure groups.
Made in my "Geospatial Intelligence: the art and science for better understanding our world" Class
Gallery
×
![]()