 Baltimore
 DC
DC
 Chicago

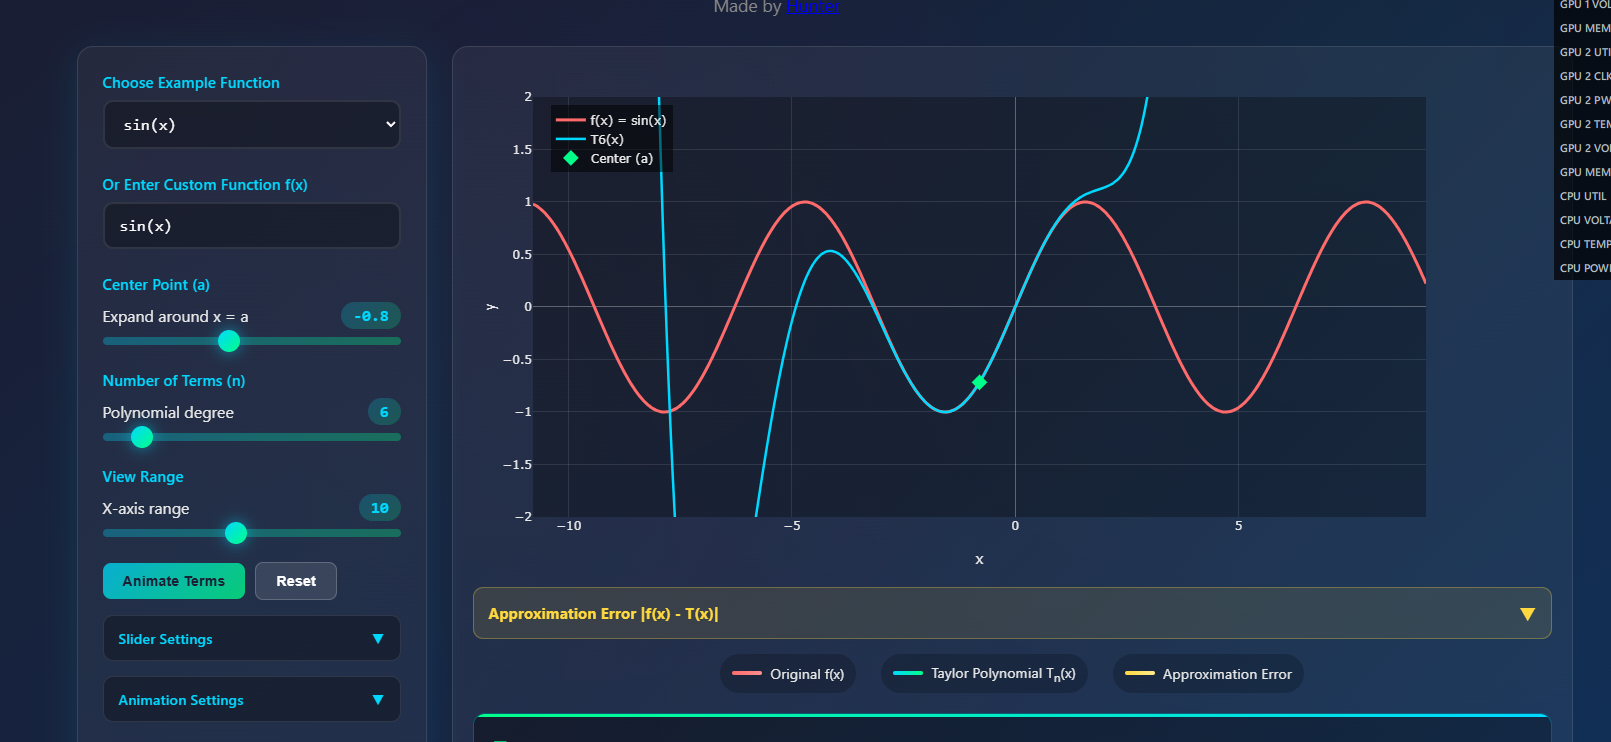
Taylor Series Visualizer
This site lets you visualize Taylor series approximations of a function in real time, showing the original curve alongside its polynomial as you adjust the expansion point and order.
It includes interactive plotting with error visualization, so you can see exactly where and how the approximation diverges as you move away from the center.
The interface also generates the corresponding LaTeX for both the general Taylor form and the expanded polynomial, with quick copy support for notes or reports.
Gallery
×
![]()